What Is a Context Graph? The Enterprise Operations Definition
Every large organization has two versions of its business processes. The first lives in PowerPoint: clean swimlane diagrams, color-coded by department, signed off in a workshop and never touched again. The second version is what actually happens: the email thread that restarts a stalled order, the SAP record updated manually because no one automated the handoff, the customer case that gets routed three times before landing with the right team.
Context graphs are built for the second version. This article defines what a context graph is in the context of business processes, explains how it differs from a traditional process map, and walks through how enterprises can build and use one to move from visibility into actual automation.
Why Process Maps Don't Reflect How Work Actually Happens
The process map, a visual diagram that shows the steps of a business process in sequence (essentially a flowchart of how work is supposed to get done), has been a fixture of enterprise operations for decades. Consultants draw them. Leaders approve them. Operations teams ignore them, not because they don't care, but because those maps describe an idealized version of reality that the daily chaos of business has long since made obsolete.
A typical order-to-cash process map might show five clean steps from purchase order to payment confirmation. The real process involves seventeen steps, three different systems, two shared inboxes, one exception that requires a phone call, and a workaround that one person in Düsseldorf invented in 2019 and never documented.
Process maps fail for three reasons.
First, they are static. Once drawn, they don't update when processes change. And in a live enterprise, processes change constantly: a new ERP module, a reorganization, a new customer segment with different requirements.
Second, they are human-authored. They reflect what people think is happening, filtered through the lens of whoever was in the room during the workshop. The edge cases, the informal workarounds, the escalation logic that lives in someone's head. None of that makes it onto the diagram.
Third, and most critically for automation purposes, they carry no data. A process map shows a box labeled “approval step.” It doesn't tell you which approvals get escalated, under what conditions, by whom, and how long they take. Without that data, any automation built on top of a process map is building on sand.
This is the gap that a context graph is designed to fill.
What Is a Context Graph? A Working Definition
A context graph is a real-time, AI-constructed map of how a business process actually unfolds, built from the messages, transactions, CRM records and ERP objects that make up the operational reality of an enterprise.
Where a process map describes flow in theory, a context graph captures flow in practice. It reconstructs what happened, who was involved, what data moved between systems, and what decisions were made at each step, by pulling that information directly from the systems where work actually happens.
In concrete terms: when a purchase order arrives in a shared inbox, triggers a case in Salesforce, requires a manual approval in SAP, and generates a confirmation email, a context graph connects all of those events into a single process representation. Each touchpoint becomes a node. Each relationship between touchpoints (the causal sequences, the time gaps, the decision logic) becomes an edge.
The result is not a diagram someone drew. It is a map that emerges from the data itself. This distinction matters enormously for enterprise automation. An automation system built on a process map inherits all the fiction of that map. An automation system built on a context graph inherits the operational reality of the organization, including its edge cases, its exceptions, and its institutional decision logic.
Context Graph vs Process Map: The Critical Difference
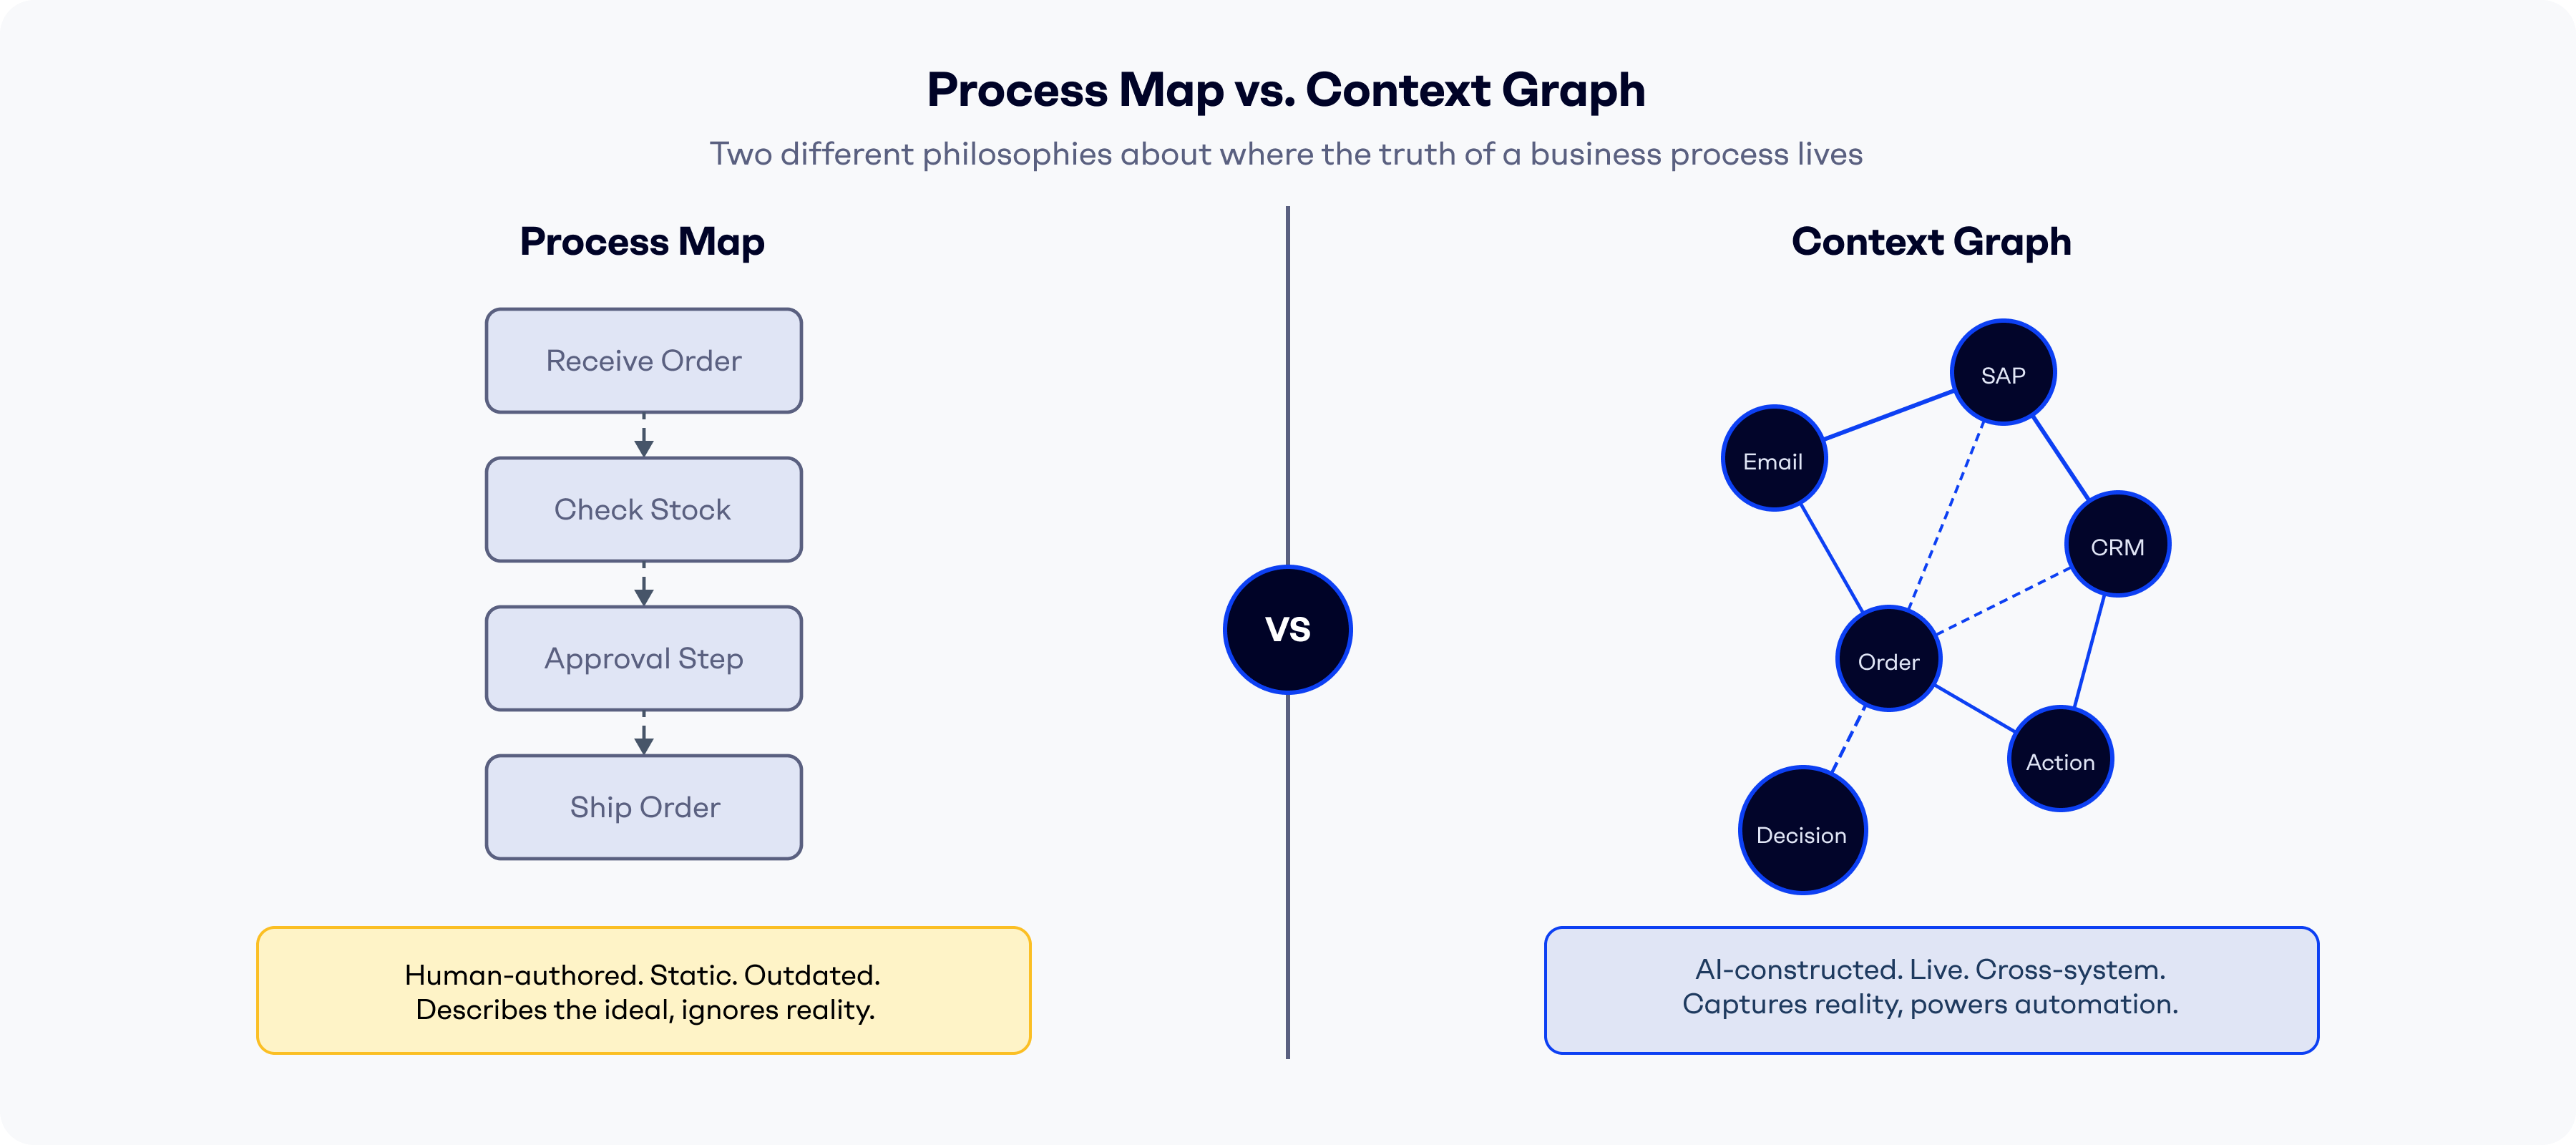
The difference between a context graph and a process map is not just technical. It is a difference in philosophy about where the truth of a business process lives.
A process map is human-authored in workshops, based on interviews and assumptions. It is updated rarely, usually only after a major project or reorganization. It shows the ideal path, so exceptions and workarounds never make it in. Decision logic is described in footnotes, if at all. As a foundation for automation, it breaks the moment real-world variance appears. The output is a static diagram.
A context graph is AI-constructed from live system data: messages, transactions, CRM and ERP objects. It updates continuously, in real time. It captures edge cases and workarounds as a matter of course, because those patterns are already in the data. Decision logic is encoded directly from actual operational history. It is built for automation. The output is a queryable, executable process model.
Process maps answer: how should this work? Context graphs answer: how does this work?
For teams trying to automate operations, only the second question is useful.
What Goes Inside an Enterprise Context Graph?
A context graph for enterprise business processes draws from four categories of data that are typically siloed from each other.
Messages and communications. Shared inboxes, email threads, support tickets. This is where the majority of business process activity is initiated and coordinated. An incoming email asking about a delayed shipment is the start of a process. The replies, escalations, and resolutions that follow are part of that same process. In most enterprises, this communication layer is entirely invisible to traditional process modeling tools.
Transactions and ERP objects. Purchase orders, invoices, delivery confirmations, payment records: the structured transactional data that lives in systems like SAP or Microsoft Dynamics. These records capture what was agreed, what was executed, and what was completed. They provide the backbone of any operational process.
CRM records and case data. Customer accounts, cases, contacts, and interaction histories from systems like Salesforce. These connect the communication layer to the customer context: who sent this inquiry, what their order history looks like, what SLAs apply to them, whether this is a repeat issue.
Workflow steps and human actions. The individual actions that people take inside enterprise systems: who updated a record, who approved a request, who reassigned a case. This is the most granular layer. It captures the decision behavior of individual operators and teams, including the informal logic that never makes it into any formal documentation.
When these four layers are connected into a single graph, the result is a complete operational picture: not just what the process looks like on paper, but every instance of how it has actually been executed across real transactions, real customers, and real employees.
How to Build a Context Graph in an Enterprise Environment
The traditional approach to building process models requires data engineering teams, months of configuration, and deep integration work across systems. Most organizations start, slow down, and stop. The complexity outpaces the business value before either can be demonstrated.
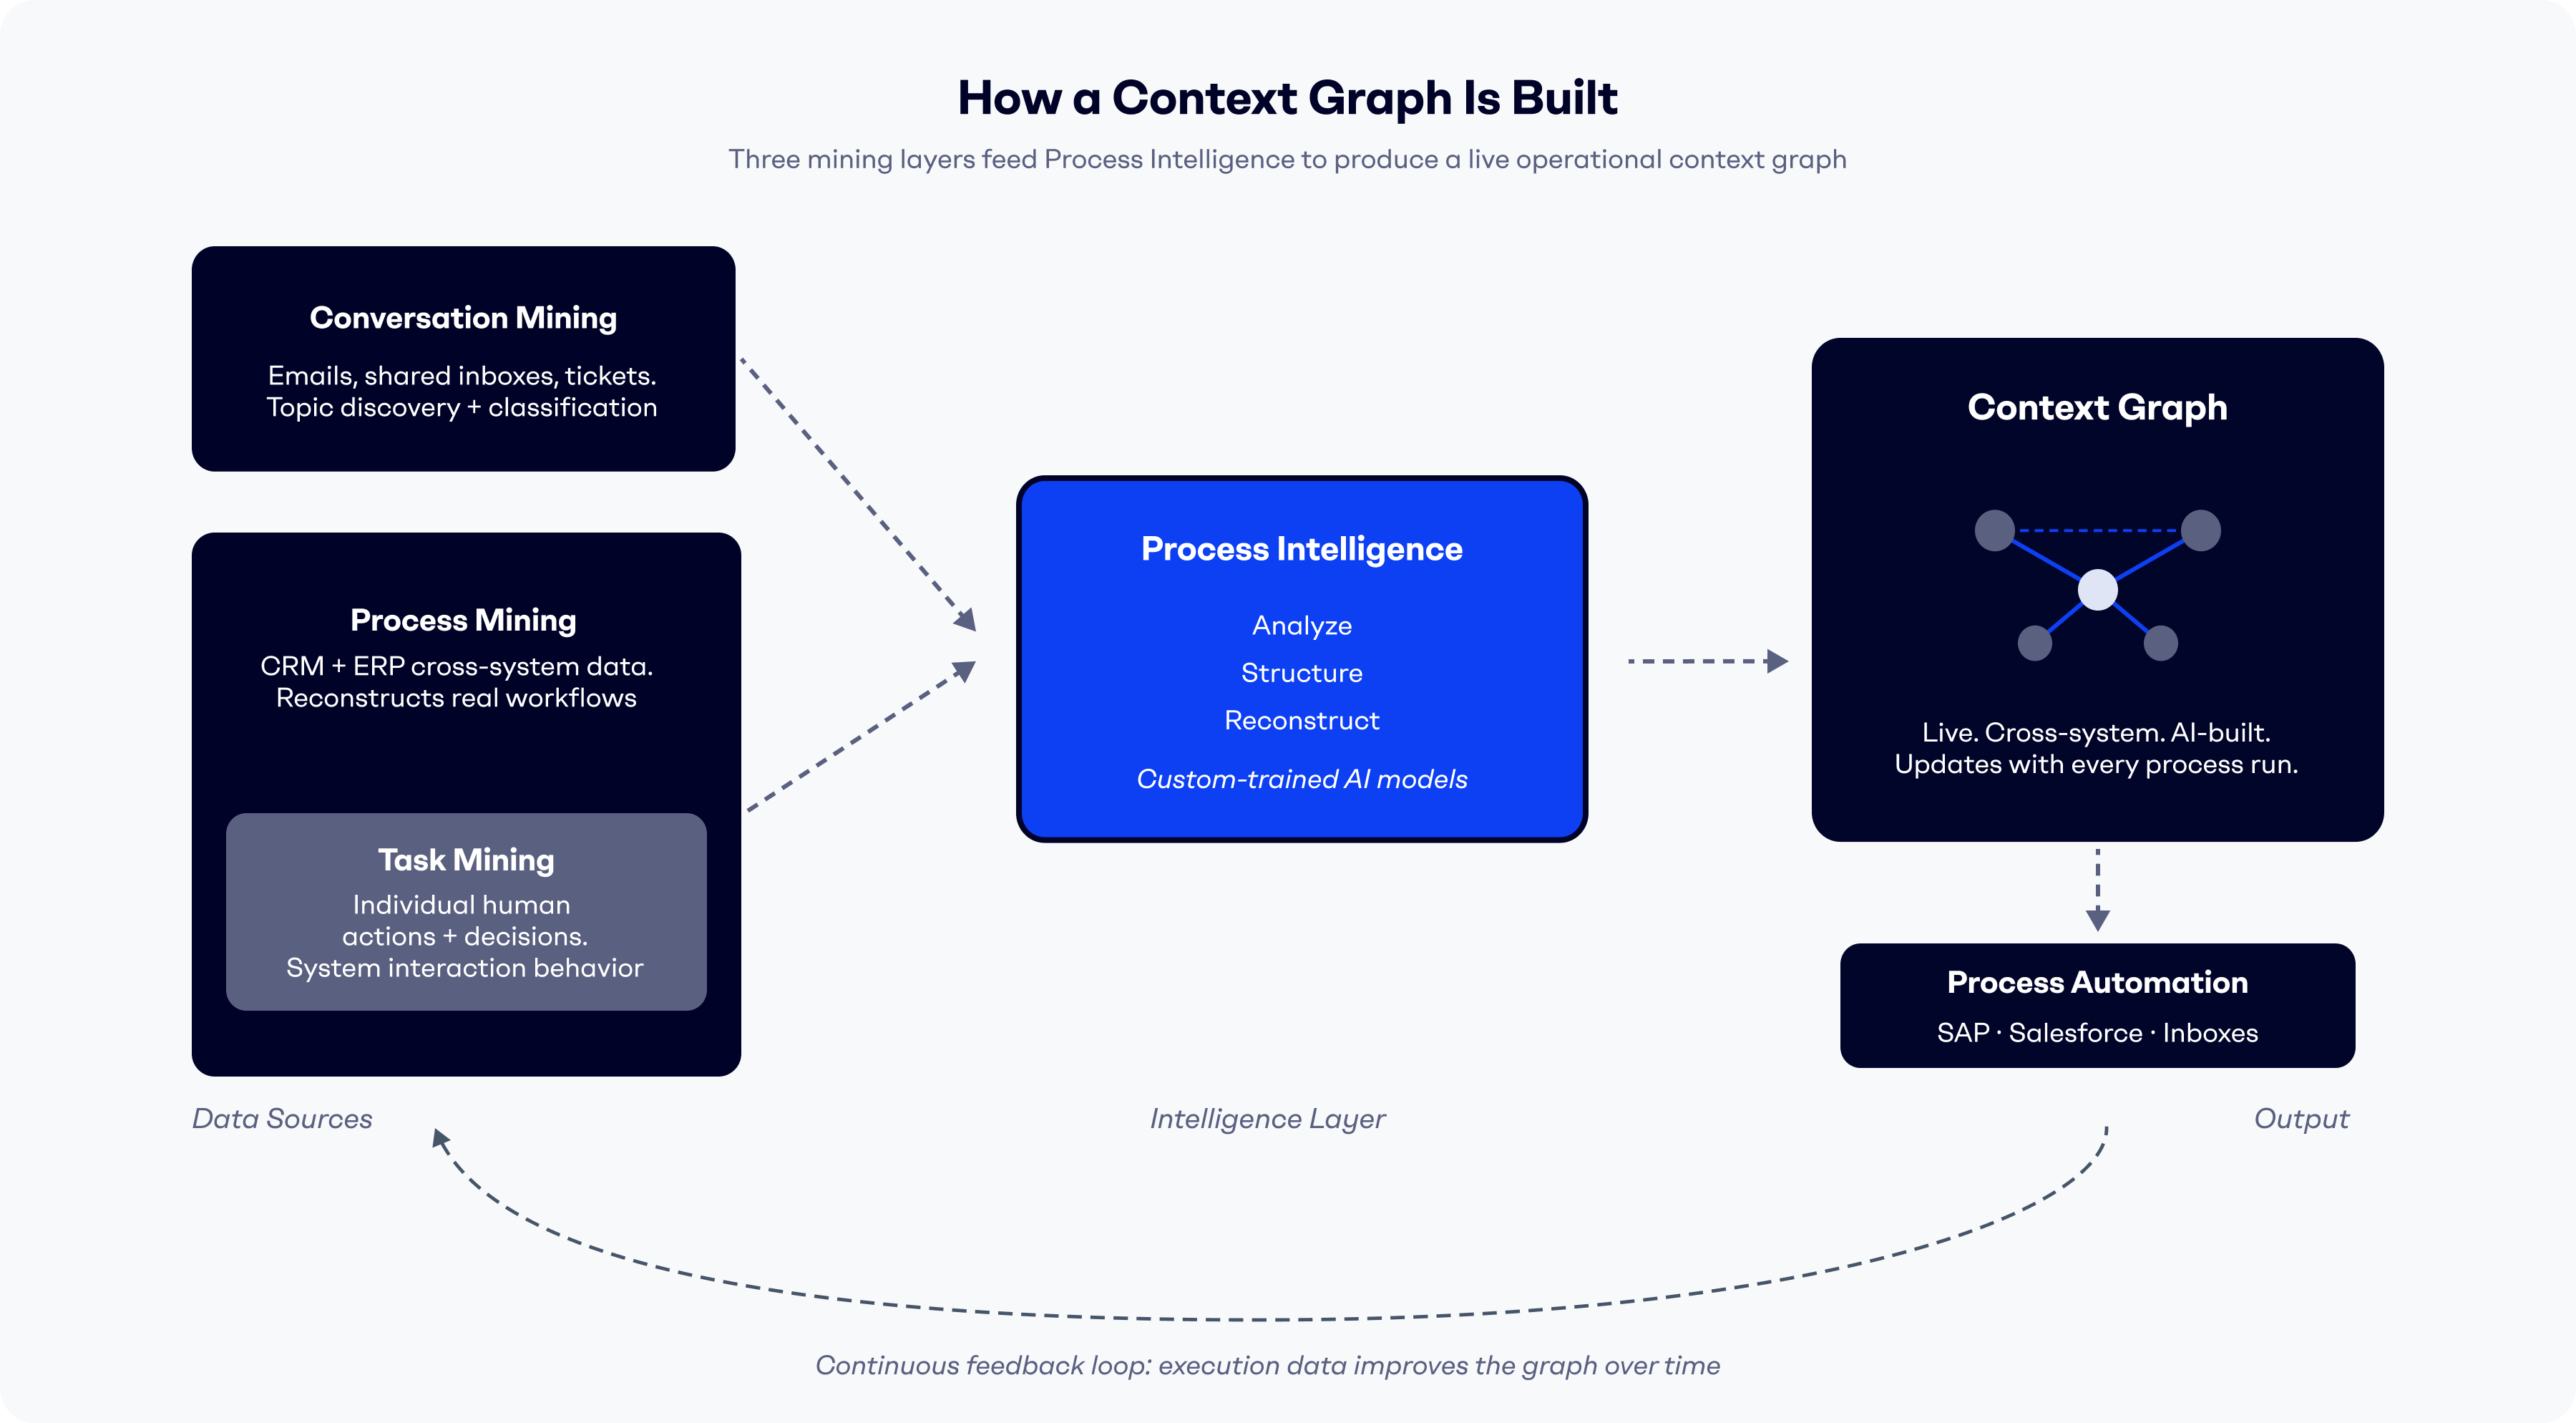
A more effective approach builds the context graph automatically from existing data sources, using three mining layers that run in parallel. This is the foundation of how Tekst works. It is why enterprises can go from zero to operational context graph in days rather than months.
Conversation Mining analyzes incoming business communications, specifically the shared inboxes and email streams where operational requests arrive. Through topic discovery and message classification, it converts unstructured messages into operational signals: what type of request is this, which process does it belong to, what data does it contain?
Process Mining reconstructs the actual operational workflows by pulling from CRM and ERP systems simultaneously. Rather than analyzing one system at a time, cross-system process mining surfaces how processes move across systems: from the email that initiates a request, through the Salesforce case it generates, to the SAP record it ultimately updates. This cross-system reconstruction is what produces the context graph: a unified view of how value actually moves through the organization.
Through task mining, which captures the behavioral layer, recording the individual human actions, decisions, and system interactions, real operational workflows can be reconstructed during process mining. This feedback loop reveals not just what the process looks like at a system level, but how specific teams and operators actually execute it.
These three mining layers feed into a process intelligence layer that analyzes, structures, and reconstructs the data into a coherent, queryable context graph. The output is not a static artifact. It is a living model that updates as new process instances complete, new exceptions are encountered, and new decision patterns emerge.
No data engineering team required. No six-month implementation. The context graph is built from what the organization is already doing.
The Link Between a Context Graph and Process Intelligence
Process intelligence is the AI-driven capability that turns raw operational data into structured, actionable process understanding. The context graph is its primary output. Tekst's enterprise process intelligence layer is built specifically to produce this output automatically, from the communication and transaction data already flowing through the organization. Think of it this way: process intelligence is the engine. The context graph is what the engine produces.
More specifically, process intelligence takes the signals from conversation mining, process mining, and task mining (the messages, transactions, CRM objects, ERP records, and human actions flowing through the organization) and uses that data to reconstruct how operational processes actually work. The result of that reconstruction is the context graph: a structured, cross-system map of process reality.
This matters because process intelligence on its own is a visibility tool. It tells you what is happening and where the bottlenecks are. The context graph goes a step further. It structures that intelligence into a format that can be acted on, not just analyzed.
The transition from process intelligence to a context graph is the transition from insight to action. It is the step that most process mining tools and business intelligence platforms miss. They can show you the bottleneck. They cannot fix it. A context graph makes the fix possible, because it gives automation systems the operational context they need to make real decisions.
How a Context Graph Enables Decision Automation
Decisions that feel complex and judgment-dependent are often pattern-dependent. The experienced operations manager who can route an escalated invoice in thirty seconds isn't performing a miracle of reasoning. They are pattern-matching against thousands of similar situations they have seen before. They know which suppliers tend to dispute certain line items. They know which approval threshold applies to this customer tier. They know that exceptions from the German office go to a specific team. A context graph captures those patterns systematically.
Once a context graph has encoded how the organization actually handles different types of cases (which inputs lead to which decisions, across which workflow paths, under which conditions), that encoded logic becomes the foundation for automated decision-making.
In practice, this works through three steps applied to each process instance. Classification identifies the intent and category of the incoming request, not from a fixed rule set, but from AI models trained on the organization's own historical data. A supplier dispute looks different across industries, languages, and ERP configurations. Custom-trained models handle that variance. Generic rule-based systems do not.
Extraction pulls the relevant business data from the request (order numbers, customer tiers, contract references, exception flags) and maps them to the correct fields in downstream systems.
Decision execution applies the decision logic encoded in the context graph to produce an action: route this case, update that record, trigger this approval, escalate to this team. The action is not prescribed by a human in advance. It is derived from the patterns the context graph has captured from real operational history.
This is what makes automation durable. RPA bots break when a PDF layout changes or a field label shifts by three pixels. Automation built on a context graph adapts, because it is operating from a model of operational reality, not a fragile script written for one specific scenario.
The result is automation that handles the 80% of clean cases automatically, and handles the 20% of edge cases intelligently, because those edge cases are already encoded in the graph. Becton Dickinson, a global medical technology leader, went live with Tekst across multiple languages in three weeks, without requiring any additional headcount or extensive team retraining. More examples are available in Tekst's customer stories.
Context Graph vs Unified Process Model: Is There a Difference?
These two terms are sometimes used interchangeably. They are related, but they describe different levels of abstraction.
A context graph is the raw representation of operational reality: the complete, cross-system map of how processes unfold across messages, transactions, and human actions. It includes everything: the clean paths, the exceptions, the variation across time and geography, the full decision trace.
A unified process model is the structured, normalized expression of the context graph, optimized for automation purposes. It takes the operational complexity captured in the context graph and organizes it into workflow schemas that automation systems can act on: defined intents, extracted data fields, execution rules, exception-handling logic.
If the context graph is the map of the territory, the unified process model is the navigation system built on top of that map.
In practice, the relationship works like this: process mining builds the context graph by reconstructing cross-system workflows from real operational data. Process intelligence uses that context graph to produce the Operational Workflows Model: the structured, classified, and extracted representation of each workflow type that the automation layer can execute.
The important point is that neither replaces the other. The context graph is the source of truth. The unified process model is the abstraction that makes that truth executable. You need both.
Organizations that try to build a unified process model without a context graph as its foundation are back to building on the PowerPoint process map: a designed representation of how they wish the process worked, rather than how it actually does.


Discover the impact of AI on your enterprise. We're here to help you get started.